
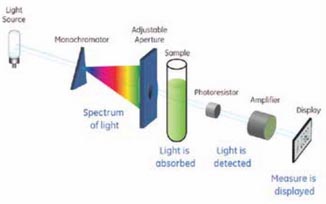
DNA concentration measurement is fundamental to most molecular biology methods. What is the basis of DNA concentration measurement? I’m always happy to find an article which has detail at the level you need to know! In a free magazine, VWR BioMarkers, there is a very useful article from GE Life Sciences.
A local copy of the spectroscopy handbook is here GE_Spectroscopy_Handbook_DNA_Protein_litdoc:. From page 6 has the DNA-RNA specific information. (The original was at http://www.gelifesciences.com/gehcls_images/GELS/ Related%20Content/Files/1354014938539/litdoc29033182_20130728225752.pdf in 11/2013 without the break after related but seems to be broken.)
There are detailed explanations of the significance of A260/A280 ratio, A260/A320 ratio and A320 background correction, and clear comments on what is ‘good’ DNA “For DNA the result of dividing the 260 nm absorption by the 280 nm needs to be greater or equal to 1.8 to indicate a good level of purity in the sample. For RNA samples this reading should be 2.0 or above” and “An A260/A230 ratio of 2 or above is indicative of a pure sample.”
Even with an increasingly ubiquitous Nanodrop, molecular biologists should have a basic knowledge of what is being measured by absorbance readings, as is given in this GE reference. NanoDrop produces a DNA RNA absorbance tipsheet describing sources of differences in its measurements from cuvette-spectroscopy, and also giving some information about the peaks. Particularly notable is the difference in absorbance of pure DNA depending on the base ratio, and the much higher absorbance of uracil compared to thymine at 260nm which leads to the higher A 260/280 absorbance ratio of pure RNA (averaging 2.0 rather than the 1.8 of DNA).
Meanwhile, how do you avoid order-of-magnitude errors? How else can you measure DNA concentration? As a molecule which can be several meters long, DNA in solution markedly changes the viscosity of water or buffer. A solution of genomic DNA in water can be checked by dipping the end of a yellow (200ul) tip, held in the hand, into the solution. As it is pulled out, a solution of 1ug/ul (that is, 0.1%) DNA will stick to the end of the tip, forming a meniscus, and break when the tip is about 1mm from the surface of the solution. Even a solution of 200ng/ul will be noticeably more ‘sticky’ to the tip than buffer or water alone. At 3ug/ul, you probably noticed you had difficulty in dissolving the DNA, and a distinct thread will be produced when pulling the tip out. Since most genomic DNA solutions you work with in molecular biology are between 250 and 2500ng/ul, you can impress your colleagues by measuring the DNA with a pipette tip, and never be embarrassed by making a 2-fold error in concentration with some experience!
Whenever DNA is run on a gel, you will be using a size marker or ladder next to the lanes with your DNA. The documentation with the ladder will tell you how many ng of DNA are included in each band of the ladder. By comparing brightness of the your bands with the standard, you can determine the amount of DNA in your preparations run on a gel. Again, whenever you are looking at a gel, visually quantify the amount of DNA in a band – then you will be prepared for the amount you expect for the next experiment!
DNA in solution is easily broken even when handled gently. If you vortex DNA, or suck it vigorously through a syringe needle of pipette tip, it will shear to a few hundred base pairs. Then the estimate of concentration from viscosity observation will differ from the concentration measurement by spectroscopy.
added nanodrop tipsheet February 2015
Adverts below from web-host and not associated.
